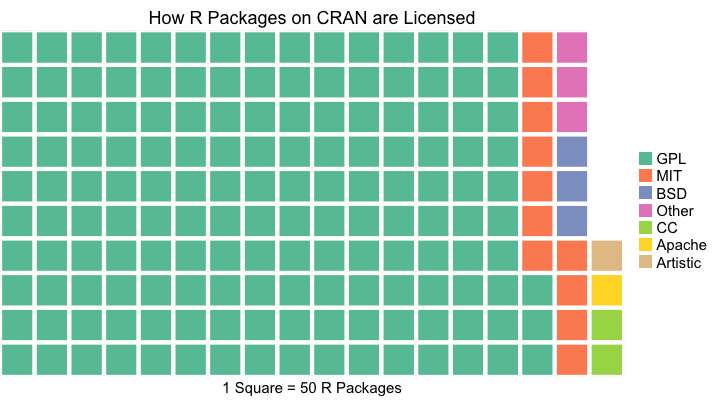
I was researching R packages and I wanted to get a sense of how they are licensed on CRAN. I’ve also been wanting to take Bob Rudis’ waffle package for a spin since I read a study by Robert Kosara and Drew Skau saying that waffle charts (square shaped pie charts) are easier to read compared to pie charts. Below is a waffle chart illustrating the major open source licensing families among R packages on CRAN.
library(dplyr)
library(magrittr)
library(purrr)
library(waffle)
library(ggplot2)

# The sorting hat will map the License field in a DESCRIPTION file
# to an open source license family.
sorting_hat <- function(student, houses){
  choice <- map_lgl(houses, grepl, x = student)
  if(!any(choice)){
    return("Other")
  } else {
    return((houses[choice])[1])
  }
}

# Get the data from CRAN
license_table <- table(available.packages()[,"License"])

# Sort licenses into families
names(license_table) %<>%
  map_chr(function(x){
    sorting_hat(x, c("Apache", "Artistic", "CC", "BSD", "MIT", "GPL"))
  })

# Tidy the data and plot!
license_tbl <- as.data.frame(license_table) %>%
  rename(License = Var1) %>%
  group_by(License) %>%
  summarize(Freq = sum(Freq)) %>%
  ungroup() %>%
  arrange(desc(Freq))

licenses <- license_tbl$Freq
names(licenses) <- license_tbl$License

waffle(licenses/50, rows = 10,
       title = "How R Packages on CRAN are Licensed",
       xlab = "1 Square = 50 R Packages") +
  theme(legend.text=element_text(size=15), axis.title.x = element_text(size=15))
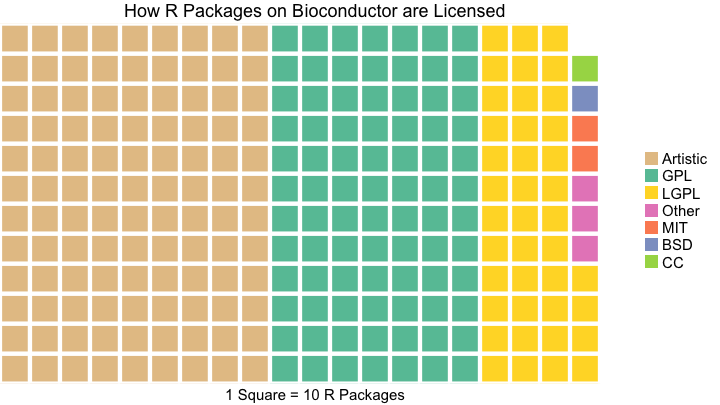
Update (Bioconductor)
@seankross @rdpeng @hrbrmstr Cool. With @bioconductor (v3.3) pkgs included there are 1148 Artistic-2.0, 8975 GPL(*), 1169 other #rstats
— Gabe Becker (@groundwalkergmb) August 2, 2016
Thanks for the idea Gabe. Below is a look at the licenses for packages on Bioconductor.
library(BiocInstaller)
bioc_table <- table(available.packages(contrib.url(biocinstallRepos())[1:4])[,"License"])

# Sort licenses into families
names(bioc_table) %<>%
  map_chr(function(x){
    sorting_hat(x, c("Artistic", "CC", "BSD", "MIT", "LGPL", "GPL"))
  })

# Tidy the data and plot!
bioc_tbl <- as.data.frame(bioc_table) %>%
  rename(License = Var1) %>%
  group_by(License) %>%
  summarize(Freq = sum(Freq)) %>%
  ungroup() %>%
  arrange(desc(Freq))

bioc <- bioc_tbl$Freq
names(bioc) <- bioc_tbl$License

waffle(bioc/10, rows = 12,
       title = "How R Packages on Bioconductor are Licensed",
       xlab = "1 Square = 10 R Packages",
       colors = c("#E5C494", "#66C2A5", "#FFD92F", "#E78AC3",
                  "#FC8D62", "#8DA0CB", "#A6D854")) +
  theme(legend.text=element_text(size=15), axis.title.x = element_text(size=15))